Searching for the perfect compliment to your campaign? The answer comes in the form of a cohesive, customized image — a Personalized Infographic. It’s a visual element worth considering if you’re looking to bolster your content marketing. In fact, statistics show Facebook posts including an image receive twice as much engagement compared to posts that don’t.
In the world of marketing, infographics are typically used to educate the viewer about a business’s product, service or anything else worth explaining. But infographics are more than informative — they’re incredibly shareable. Businesses now leverage them to help amplify their voice on social media, turn fans into brand advocates and more.
How do you leverage personalized infographics in your own marketing efforts? What’s the best way to pair infographics with your current content strategy to create a winning combo? We’ll show you what Personalized Infographics look like in action and how to leverage them to boost your content marketing efforts.
What Is a Personalized Infographic?
An infographic, in its simplest terms, is a visual representation of data. The medium has been used throughout history to simplify information. One of the first examples can be traced back to the 11th century — a scribe depicting the way planets move across the sky.
Today, they’re more likely to be shared among friends and followers across social media platforms. But it goes back to the same concept: our brains respond better to visuals over text.
One example you’ve likely seen? Infographics educating the public on COVID-19. This infographic from John Hopkins Bloomberg School of Public Health clearly explains what “more transmissible” means.
Curious about what "more transmissible" actually means to you?
Let's break that down.
🔗 https://t.co/6zAzkqeaCd pic.twitter.com/yeywsJXzI4
— Johns Hopkins Bloomberg School of Public Health (@JohnsHopkinsSPH) January 25, 2021
An infographic like this packs a punch in a singular, uniform image. Readers easily understand the proper way to wear a face covering with graphics that spark their interest.
And they’re even more informative when personalized. Think about it — if a generic infographic gives you the highlights, then a personalized infographic gives you the highlights that you want to see.
And by leveraging powerful customer data, you can transform your own infographic from generic to bespoke, effectively capturing your viewer’s attention.
How To Create a Personalized Infographic
Simply put, a personalized infographic has two parts. You combine the creative you wish to use with the data you have on hand — from your CRM, for instance — to create a completely unique infographic for every customer.
Have a few customers in mind? You can create the infographics individually with graphic design software. If you’re looking to create a Personalized Infographic on a large scale, though, an open platform that lets you automatically combine data and visuals is your best bet.
And we’ve seen its success firsthand. When added to a video campaign, Personalized Infographics drive higher social share rates.
When do Personalized Infographics work well? Here are some ideas.
- A shareable year in review: Show customers the points they earned, the money they saved, their biggest achievements and more. This one is popular. See an example of it below.
- Timely reminders: Remind your customers of an upcoming deadline before they miss it. Include all of the details they need to know to keep them informed.
- Introducing new employees: You can let them enter their own details in a simple form that syncs with a master infographic to render a custom graphic in real time. Then share it with the company so they get to know your newest team member at a glance.
Tip: You want your infographic to remain in line with your branding. Aim for colors and graphics that match your current aesthetic.
How Personalized Infographics Drive Social Engagement
How can you improve your content marketing efforts with a Personalized Infographic? It can be added on to any piece of content, but they’re especially effective as part of a Personalized Video campaign.
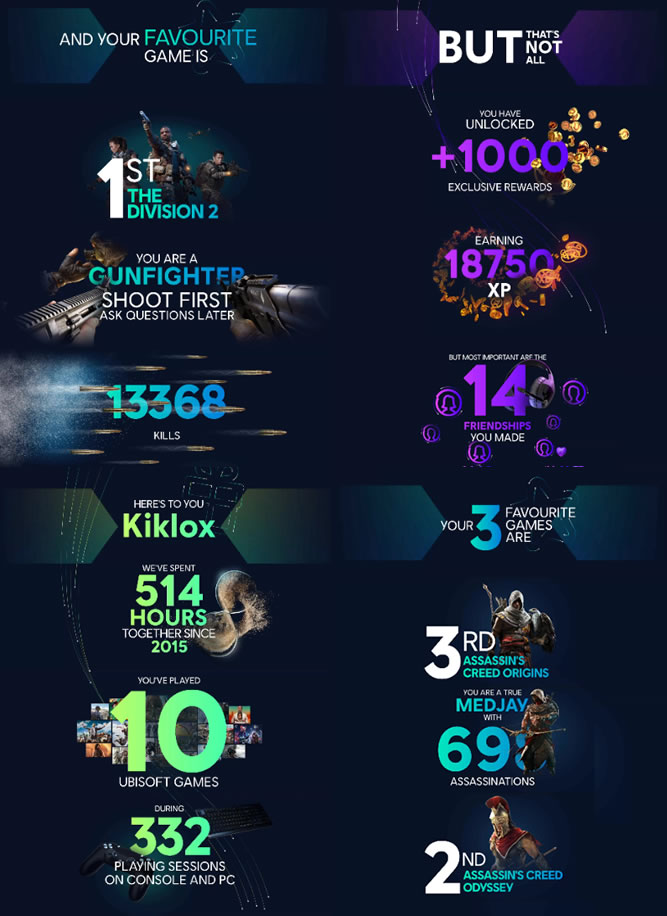
Take Ubisoft, for example. They launched a data-driven video campaign recapping the last 5 years of gaming for players. Each video featured scenes from players’ favorite video games, top stats and more for an engaging experience created with the viewer in mind.
To give customers another way to share their recap, and increase social sharing, Ubisoft decided to — you guessed it — flip the content into an additional infographic.
The image below is just a small segment, but you can click it to view the entire infographic.
Drawn from the video, each high-resolution, bespoke infographic featured the same data-driven highlights that made the video itself so engaging.
Did it work? The combination of visually stunning graphics and smart personalization was a hit — the campaign saw a 5x uplift in Facebook and Twitter share rates. And fans loved it.
441 hours 😮… 🔪⚔️⚰️#UbisoftConnectWrapup pic.twitter.com/GpczJPlrvj
— BoromirsBish 🌙 (@back_stabbath_) December 4, 2020
Creating Shareable Content With Personalized Infographics
Now that you know all the benefits on how to do Personalized Infographics for content marketing, you’re ready to get started. What message will you send? Who will you send it to?
If you’re looking to personally connect with your audience on a large scale, leveraging the right technology makes a difference. Our platform is primarily used for generating Personalized Videos, but we’ve also seen clients create some pretty cool infographics to delight their customers.
If you’re game, so are we. Let’s talk.


